Running MAIVeSS involves four screens (steps) - input, review, group color selection and result visualization. To learn more about each step, click on the respective buttons below.
Landing page providing options to input the user data for the H1N1 pandemic virus.
User Data: User can paste or upload the FASTA file with format strictly as below.
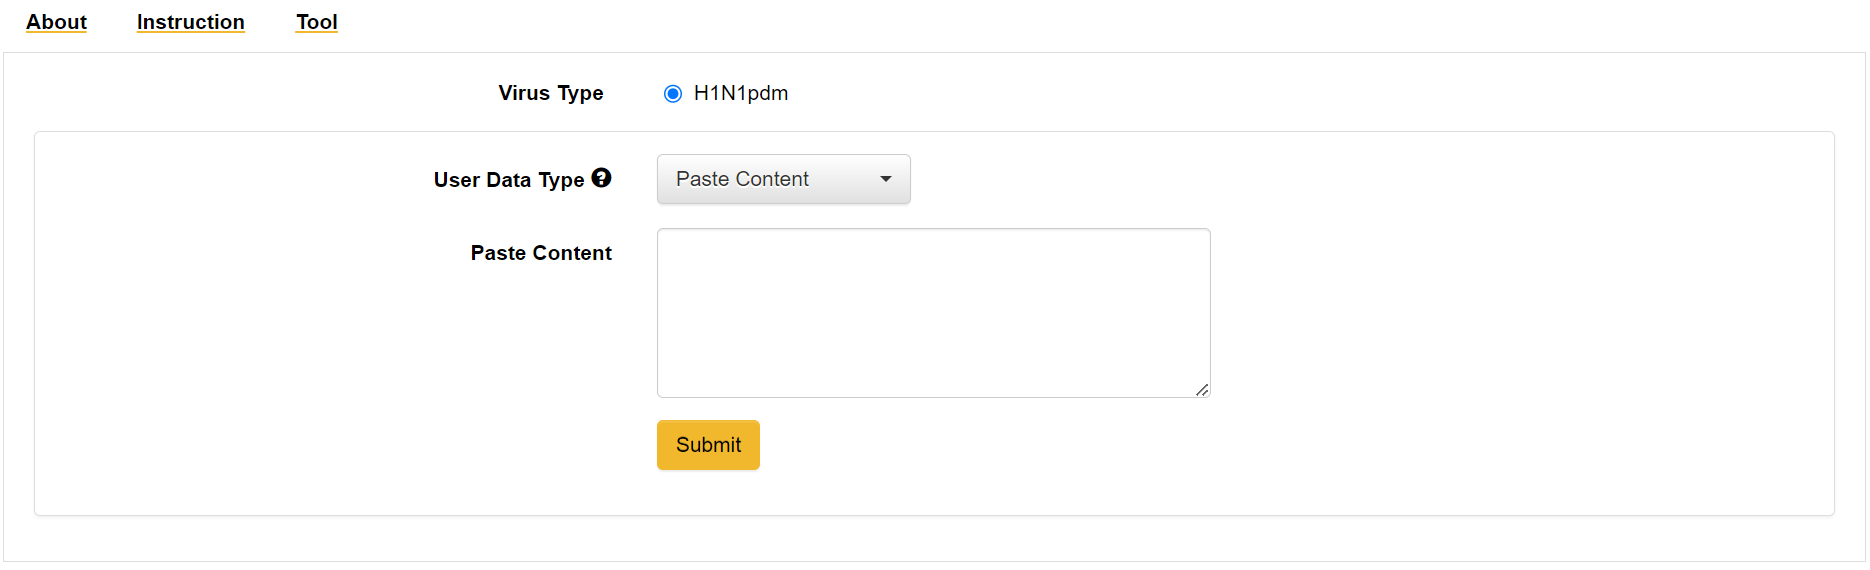
User data format:
>strain_name
...sequence...
>strain_name|year
...sequence...
>strain_name|year|region
...sequence...
Things to consider while giving the input:
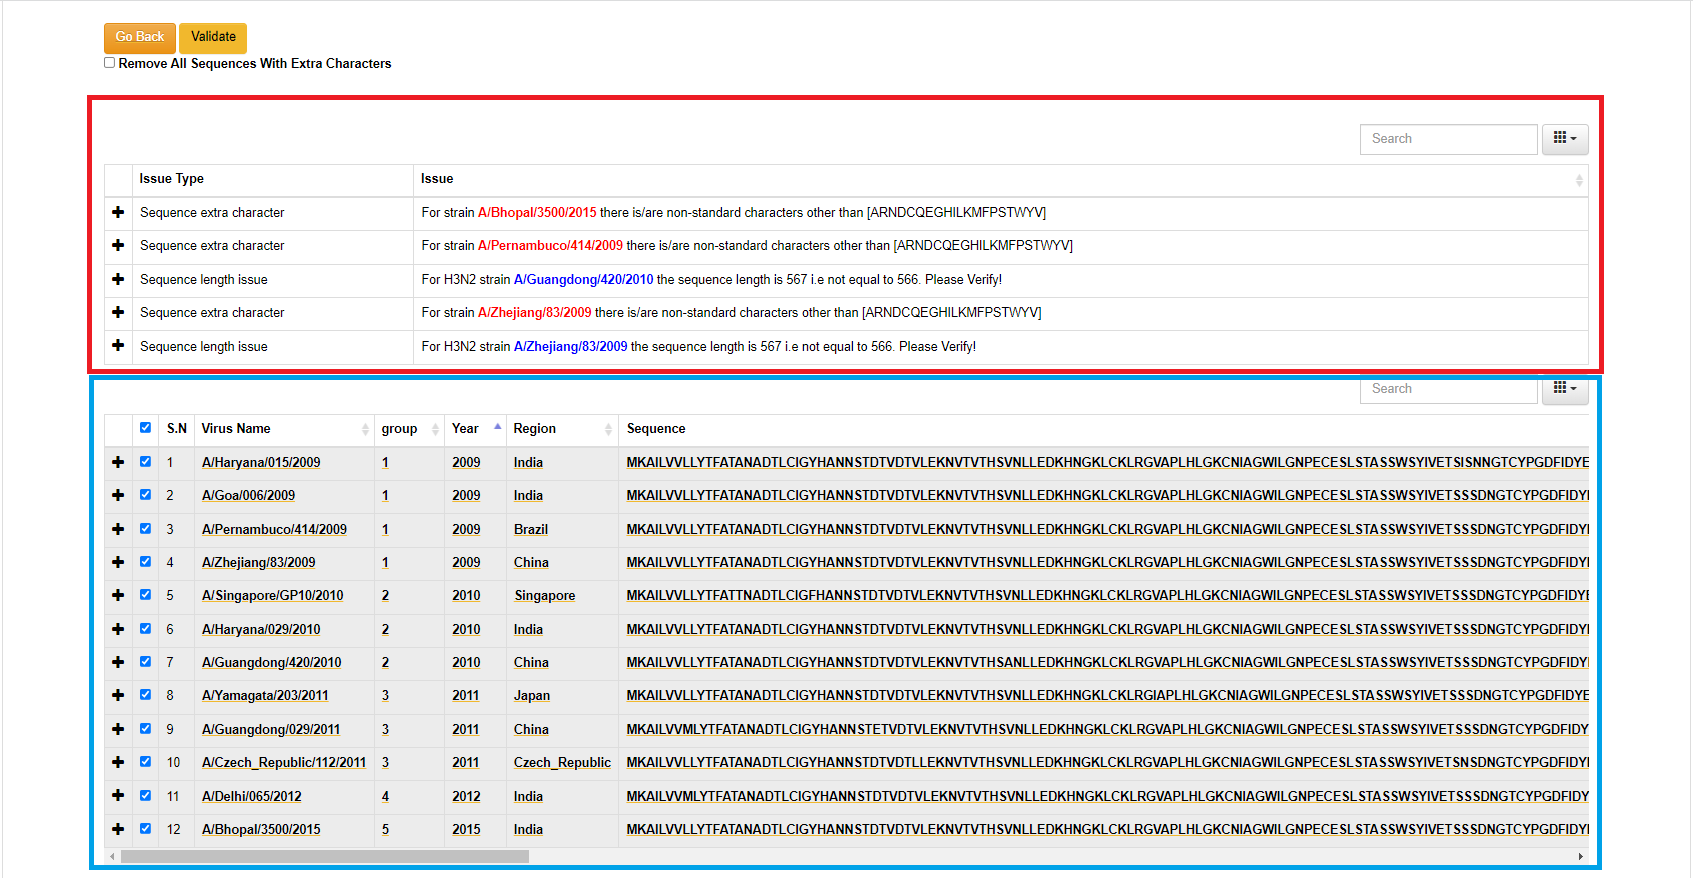
This page shows the landing page input data after the screening process.
- If there is no issue in the input data only one table will be displayed with inputs. Note: strains without year or region/country will be displayed "UNKNOWN".
- If there is any issue in the input data two tables will be dispalyed. The top table will show the issue type and the issue descripion with starin name. The blue highlighted issues are not critical but the user can still validate before submission. The red highlighted issues are critical and should be fixed and send for validation.
- The submit and cartography selection sections will only apper when there is no issue or there is/are issues with blue color highlight which are not critical.
- User can select the highlited strains name in the search box in lower table and fix the issue or can omit the strain by unselecting it.
- The group section is intially generated based on the ascending order of the year the sequeance belonging to. User can manually change the group number to desired positive intezer value which is used for the grouping and color selection during the visualization.
- The contents in the data table are editable. Click on the content to edit and click on checkmark to save.
- Click on the arrow button in the column's header to sort the data.
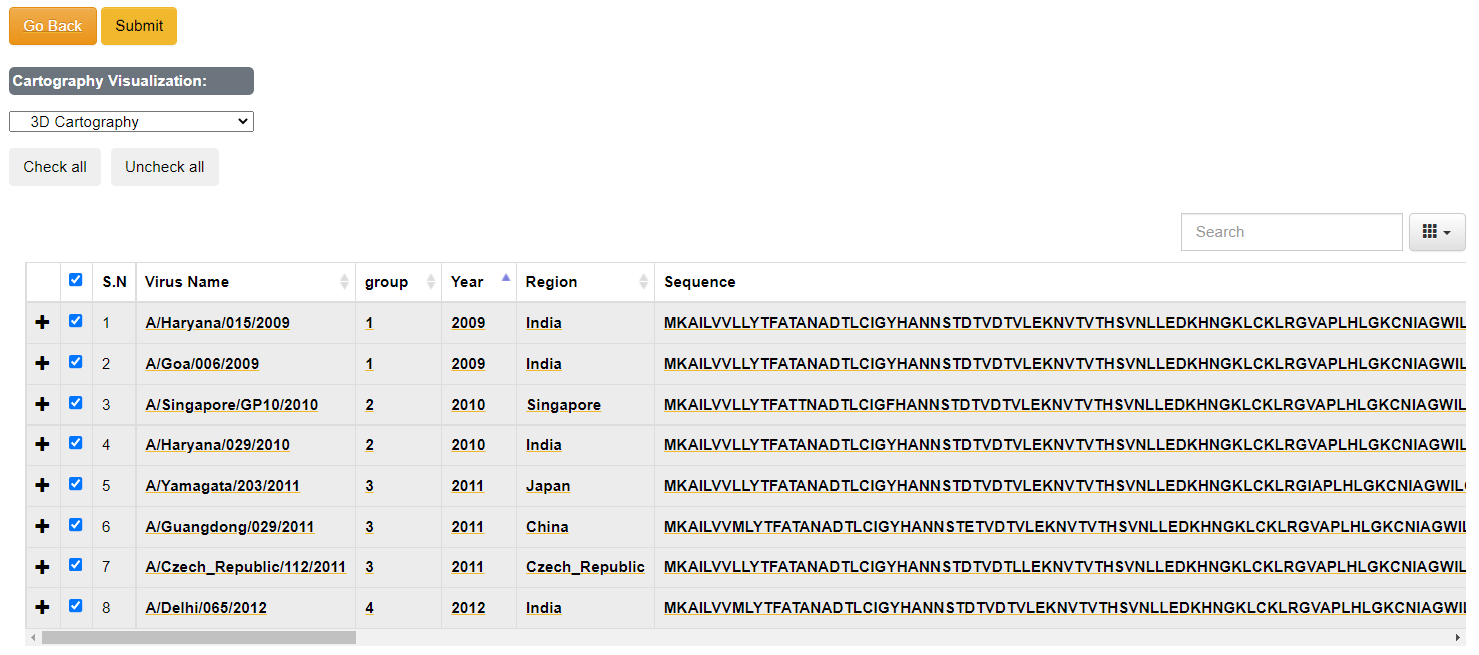
Brief Description of the options available:
- [Check All/ Uncheck All]: To select all the data use [Check all] button or you can select data manually. Minimum data selection should be greater than 5 for further processing.
- [Remove All Sequences With Extra Characters]: Select the to remove all the sequences at once that has characters other than "ARNDCQEGHILKMFPSTWYV".
- [Cartography Visualization]: This dropdown provides option to visualize the antigenic data either in 2D or 3D form (Default is 3D).
- [+]: This option can be used to view the long sequence in more space.
- [Search Box]: To check if given text is available.
- [Submit]: Use this button for further processing after you have selected the strains required.
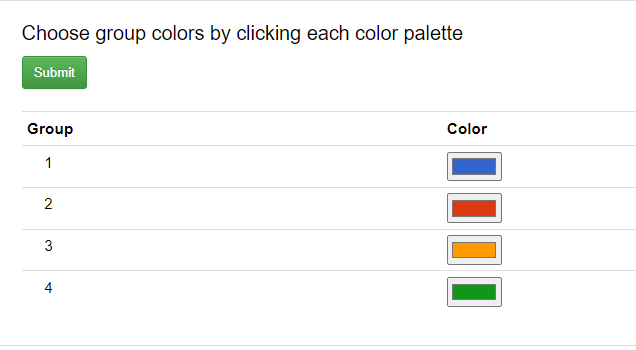
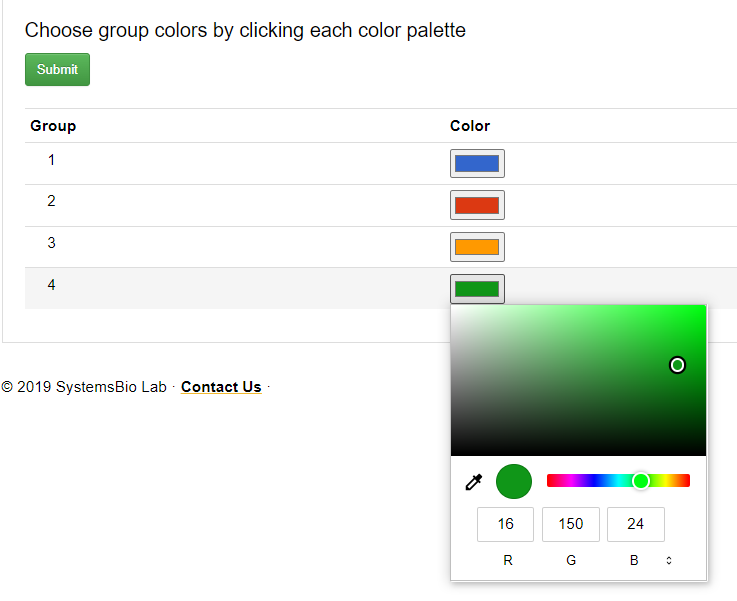
Final Output Visualization: This page provides the option for the color selection for the group values.
Brief Description of the options available:
- Initially deault color will be picked up for each group number.
- User can select a color from the color palette or provide RSV, HSL or HEV code value for the grouping color.
- After the submission the background processing will take sometime depending on the volumne of the data. Please do not resubmit, colose the window or open new tab for the web tool during the processing.
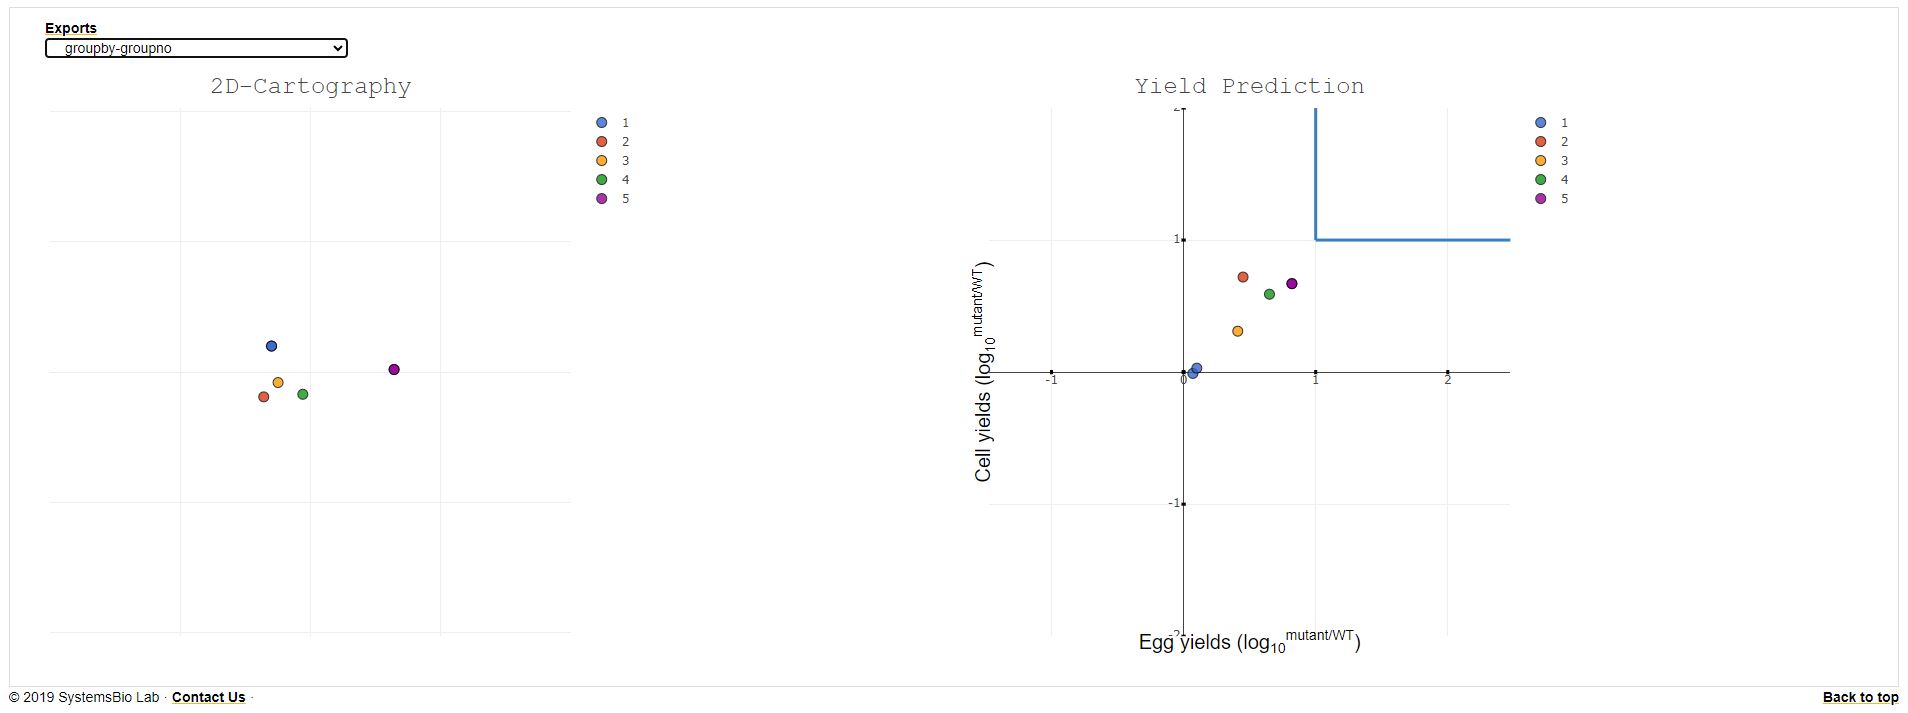
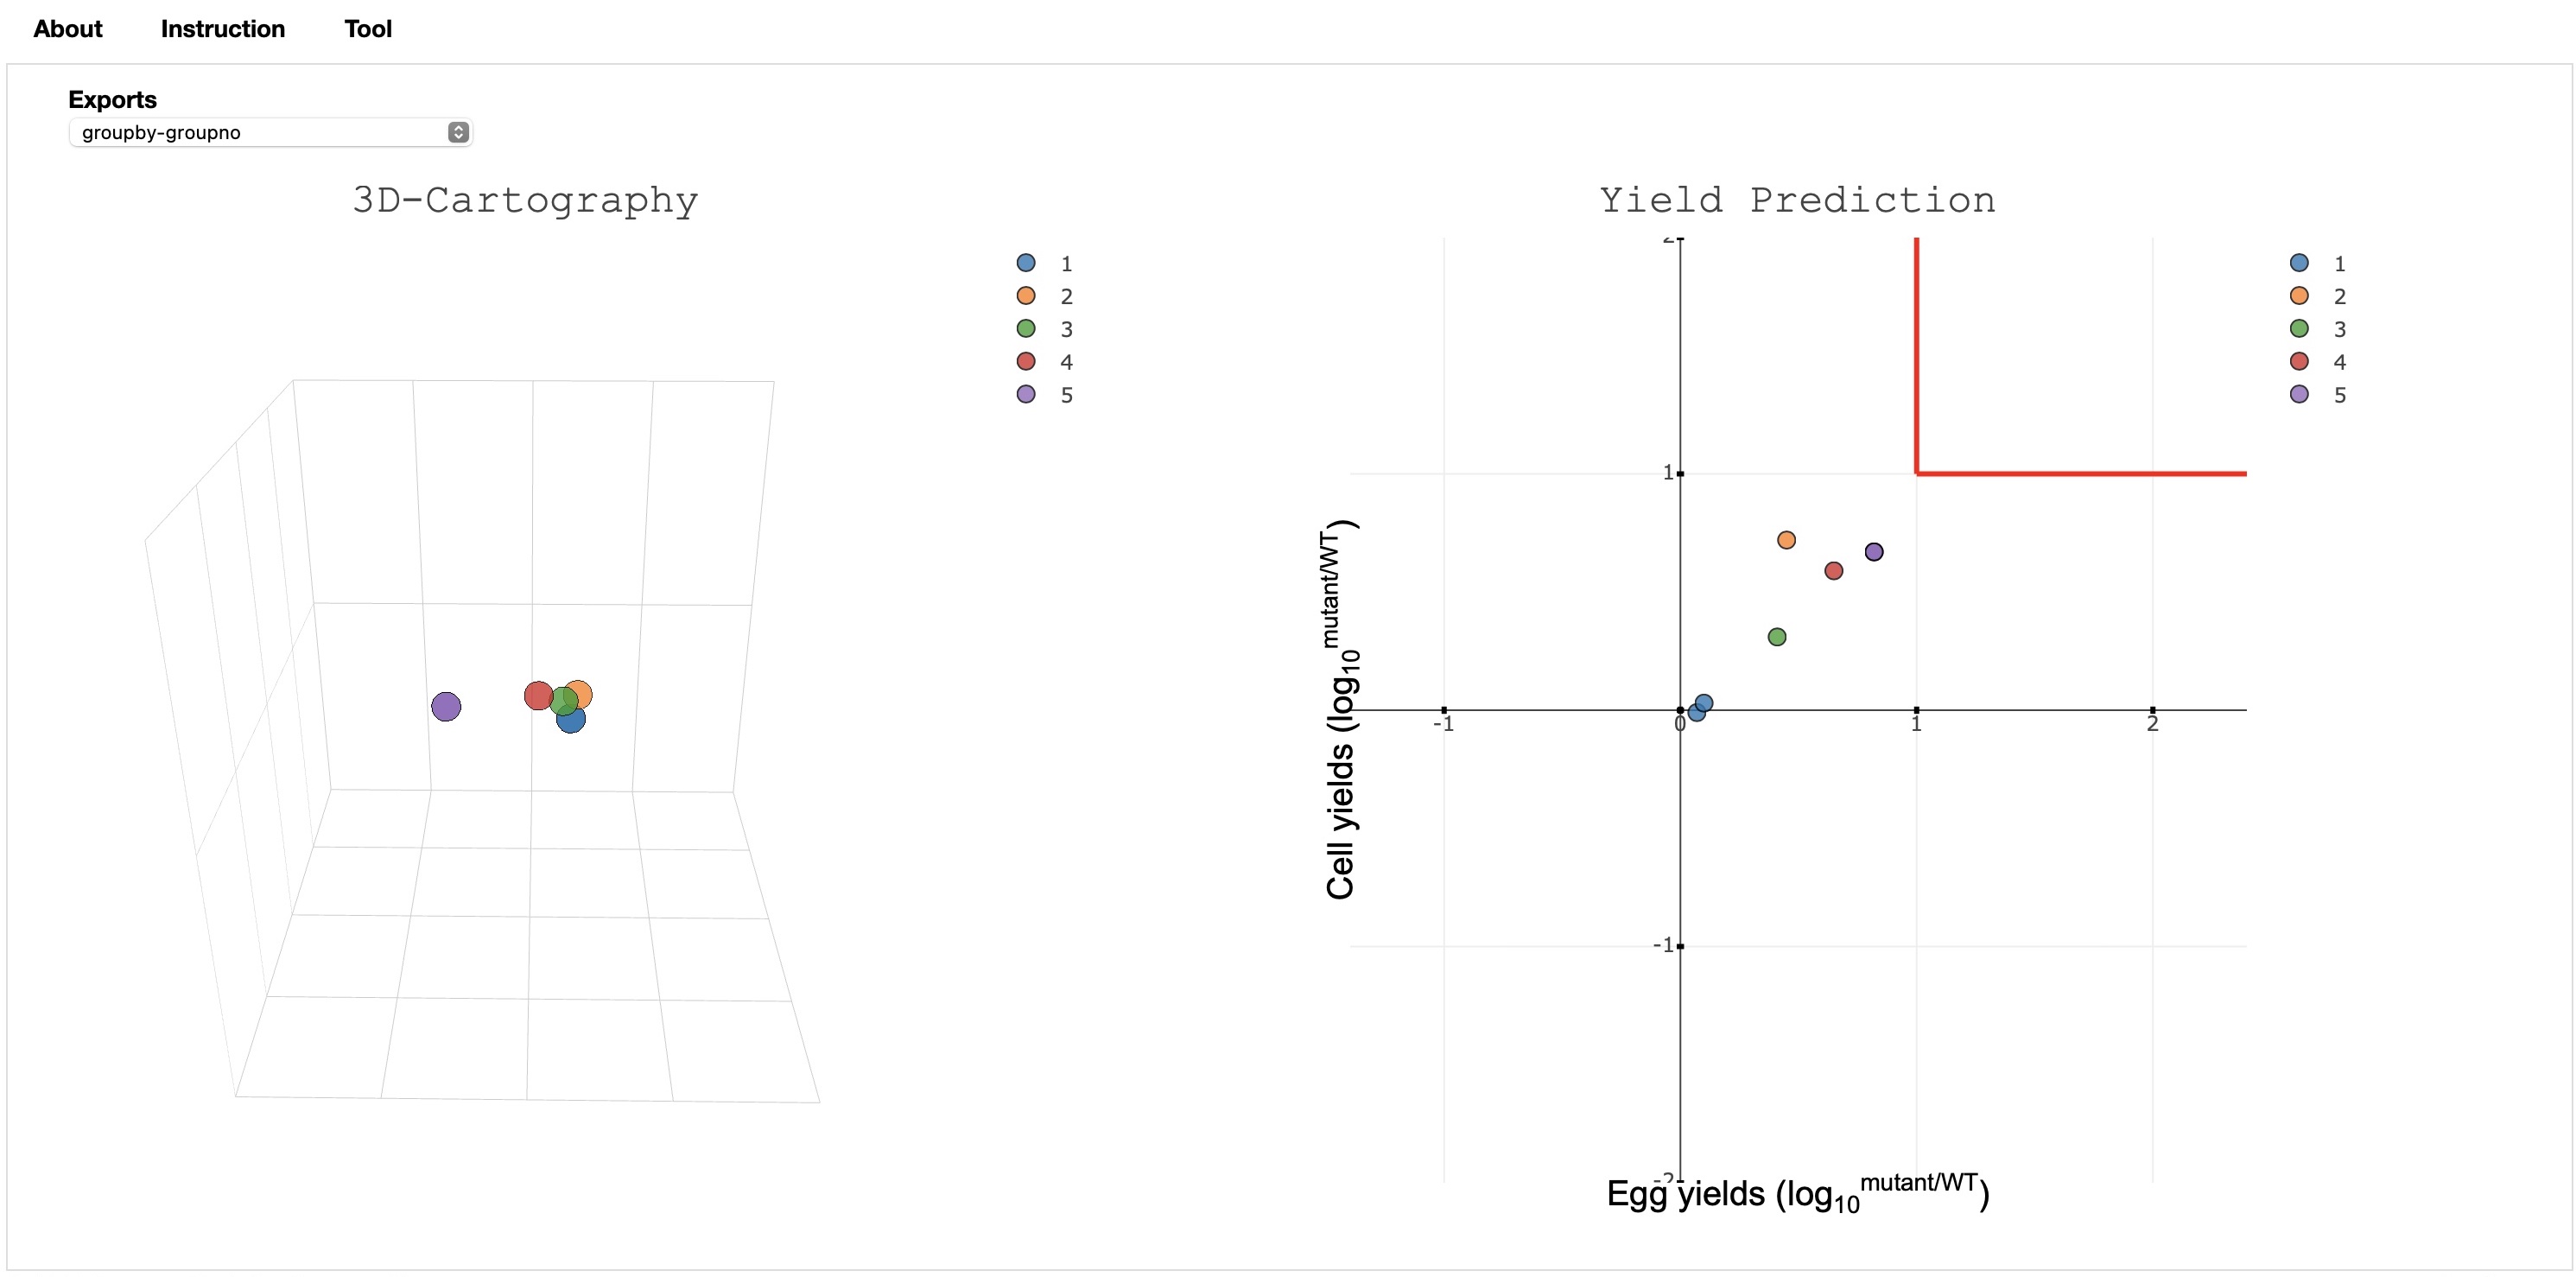
Final Output Visualization: This page provides the antigenic cartography (2D/3D) and yield as the final output.
Brief Description of the options available:
- The yield and (2D/3D) antigenic cartography are displayed side by side.
- The default coloring is done based on the group number and the color value provided by the user.User can change the grouping by selecting the groupby value to the year/group/region.
- The export button provides the option to download the antigenic matrix, and multi dimension scaling(MDS) value generated during the processing to develop the visualization.