First, let's overview the process pipeline. When you first run Rnall on a range of an fna file, RnallViewer saves a temporary file containing that subrange and passes its location as a parameter to Rnall. Rnall in turn generates a list of energies for its structure predictions corresponding to each location and window size (defaults 10-30, advancing by 2). The highest structure energy is assigned the high energy color, the lowest the low energy color, and each structure in between is assigned a color between those two based on its energy relative to the high/low structure energy. This is described in the main display customization section.
When you click on a structure (in the 3D or Main display), RnallViewer again saves a temporary fasta file, this time containing just the sequence associated with that structure (centered at its location, with the sequence + and - windowsize/2). Rnall in turn creates a CT file describing that structure with bonds between base pairs. This file is passed on to naview, which based on the naview plot preferences file found under general preferences, generates a plt file. plt22ps translates this into a postscript file, which ghostscript changes into a jpg for easy viewing. This jpg is loaded into the panel on the right.
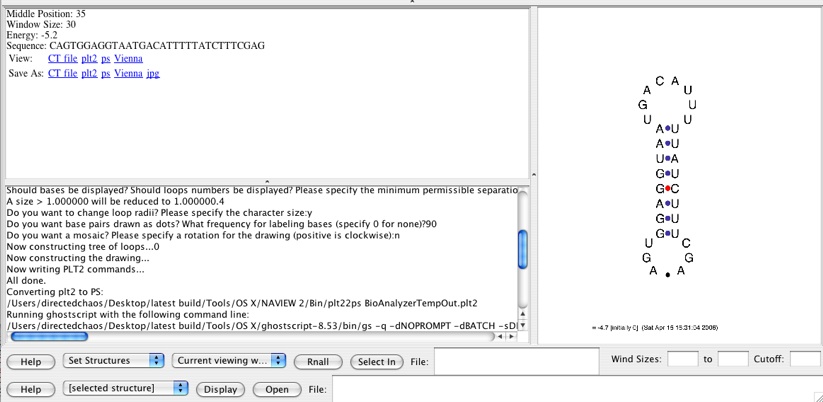
This assumes all the parts are set up properly. Here's a sample output from the console field of RnallViewer:
Running Rnall with the follow command-line:
/Users/directedchaos/Desktop/RnallViewer Project/latest build/Tools/OS X/OS X Rnall/rnall.exe -i /Users/directedchaos/Desktop/RnallViewer Project/NetBeans/RnallViewer/AnalyzerTemporarySequence.txt -o /Users/directedchaos/Desktop/RnallViewer Project/NetBeans/RnallViewer/AnalyzerRnallTempOut.ct -w 30 -g -l 30 -c -e 0 -v /Users/directedchaos/Desktop/RnallViewer Project/NetBeans/RnallViewer/AnalyzerRnallTempOutVienna.txt
Loading CT file '/Users/directedchaos/Desktop/RnallViewer Project/NetBeans/RnallViewer/AnalyzerRnallTempOut.ct' above.
Running Naview with the follow command-line:
/Users/directedchaos/Desktop/RnallViewer Project/latest build/Tools/OS X/NAVIEW 2/Bin/naview.exe AnalyzerRnallTempOut.ct RnallViewerTempOut.plt2
30 bases specified in file. Title is test
= -4.7 [initially 0] (Sat Apr 15 16:31:04 2006)20 20
Please specify a PLT2 device string:y
Please specify the plotter device dimensions in cm.n
Horizontal then vertical sizes separated by a space:0.3
Should bases be displayed? Should loops numbers be displayed? Please specify the minimum permissible separation between bases.n
A size > 1.000000 will be reduced to 1.000000.4
Do you want to change loop radii? Please specify the character size:y
Do you want base pairs drawn as dots? What frequency for labeling bases (specify 0 for none)?90
Do you want a mosaic? Please specify a rotation for the drawing (positive is clockwise):n
Now constructing tree of loops...0
Now constructing the drawing...
Now writing PLT2 commands...
All done.
Converting plt2 to PS:
/Users/directedchaos/Desktop/latest build/Tools/OS X/NAVIEW 2/Bin/plt22ps RnallViewerTempOut.plt2
Running ghostscript with the following command line:
/Users/directedchaos/Desktop/latest build/Tools/OS X/ghostscript-8.53/bin/gs -q -dNOPROMPT -dBATCH -sDEVICE=jpeg -r100 -sOutputFile=RnallViewerTempOut.jpg /Users/directedchaos/Desktop/RnallViewer Project/NetBeans/RnallViewer/RnallViewerTempOut.ps
If you look closely, Naview's plot preference questions don't line up exactly with the plot preferences file responses. They're both being output at Java's timing discretion, which has to do with the separate buffers. Don't trust it for exact debugging if you're customization the display preferences file. See Naview documentation for more information on details; the basic idea is just that each subsequent line answers the next Naview question.